Automating Pivot Tables with Python
In the last post I explained the basic concept behind Pivot Tables and provided some examples. Pivot tables are an easy-to-use tool to derive some basic business intelligence from your data. As discussed last time, there are occasions when you'll need to do interactive data mining by changing column and row fields. But in my experience, it's handy to have my favorite reports built automatically, with the reports ready to go as soon as I open the spreadsheet. In this post I'll develop and explain the code to create a set of pivot tables automatically in worksheet.
The goal of this exercise is to automate the generation of pivot tables from the last post, and save them to a new Excel file.
I started with the file newABCDCatering.xls from the previous post and record the macro to create this simple pivot table showing Net Bookings by Sales Rep and Food Name for the last four quarters.
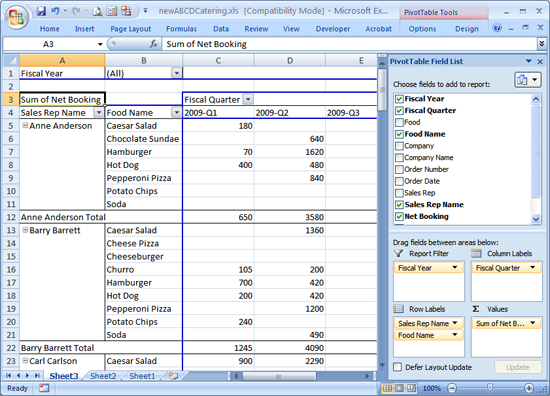
Captured in Excel 2007, the recorded macro looks like this:
'
' Macro2 Macro
'

'
    Selection.CurrentRegion.Select
    Sheets.Add
    ActiveWorkbook.PivotCaches.Create(SourceType:=xlDatabase, SourceData:= _
        "Sheet2!R1C1:R791C13", Version:=xlPivotTableVersion10).CreatePivotTable _
        TableDestination:="Sheet3!R3C1", TableName:="PivotTable1", DefaultVersion _
        :=xlPivotTableVersion10
    Sheets("Sheet3").Select
    Cells(3, 1).Select
    With ActiveSheet.PivotTables("PivotTable1").PivotFields("Fiscal Year")
        .Orientation = xlPageField
        .Position = 1
    End With
    With ActiveSheet.PivotTables("PivotTable1").PivotFields("Fiscal Quarter")
        .Orientation = xlColumnField
        .Position = 1
    End With
    With ActiveSheet.PivotTables("PivotTable1").PivotFields("Sales Rep Name")
        .Orientation = xlRowField
        .Position = 1
    End With
    With ActiveSheet.PivotTables("PivotTable1").PivotFields("Food Name")
        .Orientation = xlRowField
        .Position = 2
    End With
    ActiveSheet.PivotTables("PivotTable1").AddDataField ActiveSheet.PivotTables( _
        "PivotTable1").PivotFields("Net Booking"), "Sum of Net Booking", xlSum
End Sub
The post Mapping Excel VB Macros to Python covered a technique for recording a Visual Basic macro and porting it to Python. Using that approach, you could simply turn on the macro recorder and generate all the required tables, producing a long script with lots of redundancy. A better approach is to build a general purpose function that can be used over and over to generate the pivot tables.
Looking at the macro, you see lines specifying the Orientation of the field name, such as .Orientation = xlRowField and .Orientation = xlColumnField. A pivot table has four basic areas for fields:
- Report Filter (
.Orientation = xlPageField) - Column area (
.Orientation = xlColumnField) - Row area (
.Orientation = xlRowField) - Values area (
PivotTables().AddDataField())
Each of these supports multiple fields (column fields for Sales Rep Name and Food Name were added in the example). The ordering of the fields changes the appearance of the table.
A general pattern should be apparent in this macro. First, the pivot table is created with the ActiveWorkbook.PivotCaches.Create() statement. Next, the columns and rows are configured with a series of ActiveSheet.PivotTables("PivotTable1").PivotFields() statements. Finally, the field used in the Values section of the table is configured using the ActiveSheet.PivotTables("PivotTable1").AddDataField statement. The general purpose function will need to contain all of these constructs. Note the parts that can't be hard-coded: the source of the data, "Sheet2!R1C1:R791C13", and destination for the table, "Sheet3!R3C1" need to be determined based on the characteristics of the source data and can't be hard coded in the general solution.
In Python, this pattern can be reduced to the following loop that covers fields for the Report Filter, Columns and Rows:
def addpivot(wb,sourcedata,title,filters=(),columns=(),
             rows=(),sumvalue=(),sortfield=""):
    """Build a pivot table using the provided source location data
    and specified fields
    """
    ...
    for fieldlist,fieldc in ((filters,win32c.xlPageField),
                            (columns,win32c.xlColumnField),
                            (rows,win32c.xlRowField)):
        for i,val in enumerate(fieldlist):
            wb.ActiveSheet.PivotTables(tname).PivotFields(val).Orientation = fieldc
        wb.ActiveSheet.PivotTables(tname).PivotFields(val).Position = i+1
    ...
Processing the Values field is more or less copied from the Visual Basic. To keep things simple in this example, this code is limited to adding "Sum of" values only, and doesn't handle other Summarize Value functions such as Count, Min, Max, etc.
wb.ActiveSheet.PivotTables(tname).AddDataField(
    wb.ActiveSheet.PivotTables(tname).PivotFields(sumvalue[7:]),
    sumvalue,
    win32c.xlSum)
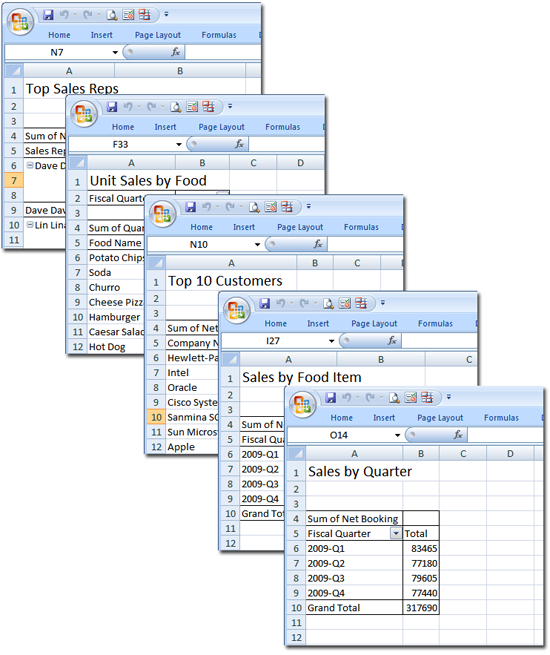
The actual values for filters, columns and rows in the function are defined in the call to the function. The complete function creates a new sheet within the workbook, then adds an empty pivot table to the sheet and builds the table using the field information provided. For example, to answer the question: What were the total sales in each of the last four quarters?, the pivot table is built with the following call to the addpivot function:
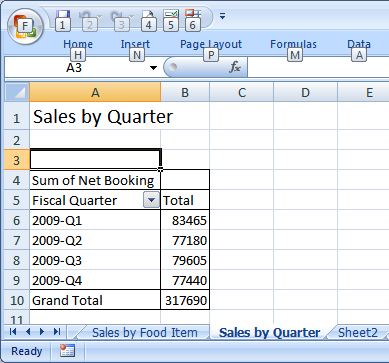
# What were the total sales in each of the last four quarters?
addpivot(wb,src,
         title="Sales by Quarter",
         filters=(),
         columns=(),
         rows=("Fiscal Quarter",),
         sumvalue="Sum of Net Booking",
         sortfield=())
which defines a pivot table using the row header "Fiscal Quarter" and data value "Sum of Net Booking". The title "Sales by Quarter" is used to name the sheet itself.
To make the output spreadsheet more understandable, the title parameter passed into the function and used as a title in each worksheet and as the tab name.
The complete script is shown below. Caveats:
- This script has been modified to run on both Excel 2007 and Excel 2003 and has been tested on those versions.
-
Adding pivot tables increases the size of the output Excel file, which can be mitigated by disabling caching of pivot table data. Line 48 of the script contains the command
newsheet.PivotTables(tname).SaveData = False, which has been commented out. Uncommenting this command will reduce the size of the output Excel file, but will require that the pivot table be refreshed before use by clicking on Refresh Data on the PivotTable toolbar.
erpdatapivot.py:
Load raw EPR data, clean up header info and
build 5 pivot tables
import win32com.client as win32 win32c = win32.constants import sys import itertools tablecount = itertools.count(1)
def addpivot(wb,sourcedata,title,filters=(),columns=(), rows=(),sumvalue=(),sortfield=""): """Build a pivot table using the provided source location data and specified fields """ newsheet = wb.Sheets.Add() newsheet.Cells(1,1).Value = title newsheet.Cells(1,1).Font.Size = 16
# Build the Pivot Table
tname = "PivotTable%d"%tablecount.next()

pc = wb.PivotCaches().Add(SourceType=win32c.xlDatabase,
                             SourceData=sourcedata)
pt = pc.CreatePivotTable(TableDestination="%s!R4C1"%newsheet.Name,
                         TableName=tname,
                         DefaultVersion=win32c.xlPivotTableVersion10)
wb.Sheets(newsheet.Name).Select()
wb.Sheets(newsheet.Name).Cells(3,1).Select()
for fieldlist,fieldc in ((filters,win32c.xlPageField),
                        (columns,win32c.xlColumnField),
                        (rows,win32c.xlRowField)):
    for i,val in enumerate(fieldlist):
        wb.ActiveSheet.PivotTables(tname).PivotFields(val).Orientation = fieldc
        wb.ActiveSheet.PivotTables(tname).PivotFields(val).Position = i+1

wb.ActiveSheet.PivotTables(tname).AddDataField(
    wb.ActiveSheet.PivotTables(tname).PivotFields(sumvalue[7:]),
    sumvalue,
    win32c.xlSum)
if len(sortfield) != 0:
    wb.ActiveSheet.PivotTables(tname).PivotFields(sortfield[0]).AutoSort(sortfield[1], sumvalue)
newsheet.Name = title

# Uncomment the next command to limit output file size, but make sure
# to click Refresh Data on the PivotTable toolbar to update the table
# newsheet.PivotTables(tname).SaveData = False

return tname
def runexcel(): excel = win32.gencache.EnsureDispatch('Excel.Application') #excel.Visible = True try: wb = excel.Workbooks.Open('ABCDCatering.xls') except: print "Failed to open spreadsheet ABCDCatering.xls" sys.exit(1) ws = wb.Sheets('Sheet1') xldata = ws.UsedRange.Value newdata = [] for row in xldata: if len(row) == 13 and row[-1] is not None: newdata.append(list(row)) lasthdr = "Col A" for i,field in enumerate(newdata[0]): if field is None: newdata[0][i] = lasthdr + " Name" else: lasthdr = newdata[0][i] rowcnt = len(newdata) colcnt = len(newdata[0]) wsnew = wb.Sheets.Add() wsnew.Range(wsnew.Cells(1,1),wsnew.Cells(rowcnt,colcnt)).Value = newdata wsnew.Columns.AutoFit()
src = "%s!R1C1:R%dC%d"%(wsnew.Name,rowcnt,colcnt)

# What were the total sales in each of the last four quarters?
addpivot(wb,src,
         title="Sales by Quarter",
         filters=(),
         columns=(),
         rows=("Fiscal Quarter",),
         sumvalue="Sum of Net Booking",
         sortfield=())

# What are the sales for each food item in each quarter?
addpivot(wb,src,
         title="Sales by Food Item",
         filters=(),
         columns=("Food Name",),
         rows=("Fiscal Quarter",),
         sumvalue="Sum of Net Booking",
         sortfield=())

# Who were the top 10 customers for ABCD Catering in 2009?
addpivot(wb,src,
         title="Top 10 Customers",
         filters=(),
         columns=(),
         rows=("Company Name",),
         sumvalue="Sum of Net Booking",
         sortfield=("Company Name",win32c.xlDescending))

# Who was the highest producing sales rep for the year?
addpivot(wb,src,
         title="Top Sales Reps",
         filters=(),
         columns=(),
         rows=("Sales Rep Name","Company Name"),
         sumvalue="Sum of Net Booking",
         sortfield=("Sales Rep Name",win32c.xlDescending))

# What food item had the highest unit sales in Q4?
ptname = addpivot(wb,src,
         title="Unit Sales by Food",
         filters=("Fiscal Quarter",),
         columns=(),
         rows=("Food Name",),
         sumvalue="Sum of Quantity",
         sortfield=("Food Name",win32c.xlDescending))
wb.Sheets("Unit Sales by Food").PivotTables(ptname).PivotFields("Fiscal Quarter").CurrentPage = "2009-Q4"

if int(float(excel.Version)) >= 12:
    wb.SaveAs('newABCDCatering.xlsx',win32c.xlOpenXMLWorkbook)
else:
    wb.SaveAs('newABCDCatering.xls')
excel.Application.Quit()
if name == "main": runexcel()
Prerequisites
Python (refer to http://www.python.org)
Microsoft Excel (refer to http://office.microsoft.com/excel)
Source Files and Scripts
Source for the program erpdatapivot.py and input spreadsheet file ABCDCatering.xls are available at http://github.com/pythonexcels/examples
Thanks — Dan