Extending Pivot Table Data | Python Excels
As shown in the last post, Automating Pivot Tables with Python, Python and Excel can help you quickly clean up a spreadsheet, organize data and build useful reports in very few lines of code. Another useful data preparation technique is to build new columns of information based on the available data. For example, you could add an industry segment column to group company names by industry, or add an item type column to group sales items by category. While Excel does have some functions to help with adding new data fields, automation with Python eliminates the tedium of clicking column names and entering formulas.
Excel does provide a function for calculating new values within a pivot table. One example is extending a pivot table containing pricing and quantity data to compute an average selling price. For example, given the table below:
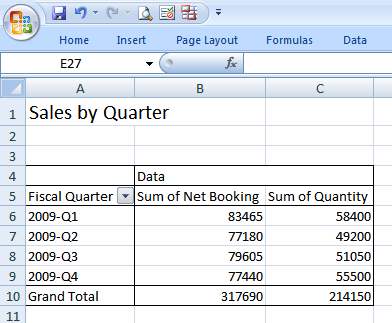
a new label called "ASP", which is the Net Booking divided by the Quantity, can be added quickly and easily with Excel's Calculated Field capability.
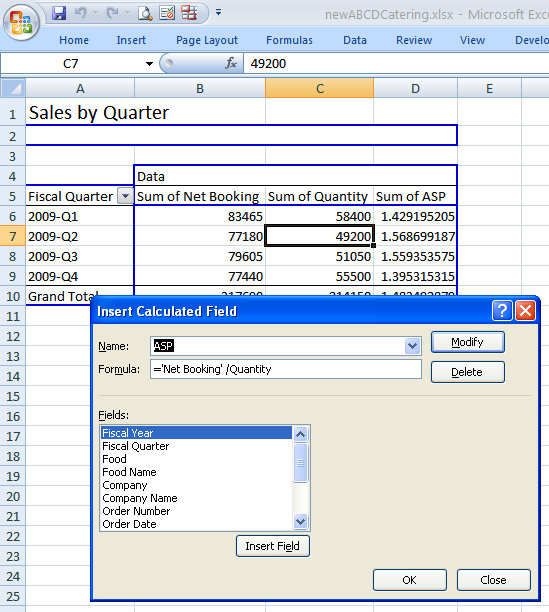
This feature is handy for adding labels on the fly that require a simple calculation.
In other cases, deriving the new field may not be so simple, yet needs to be performed each time the spreadsheet is updated. Python can programmatically add new data fields to the source table so that the data is ready for viewing whenever the pivot table is opened.
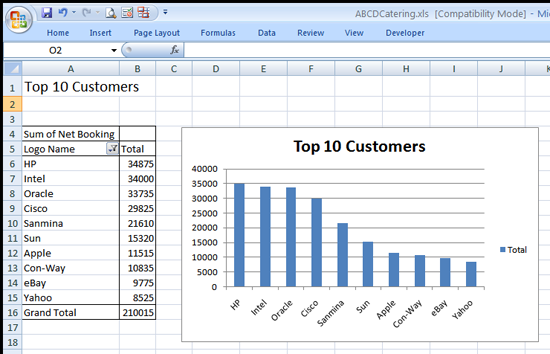
The script developed last time automated the data cleanup and pivot table generation tasks. Doing some further analysis based on the output spreadsheet, I created a chart of the Top 10 Customers for ABCD Catering:
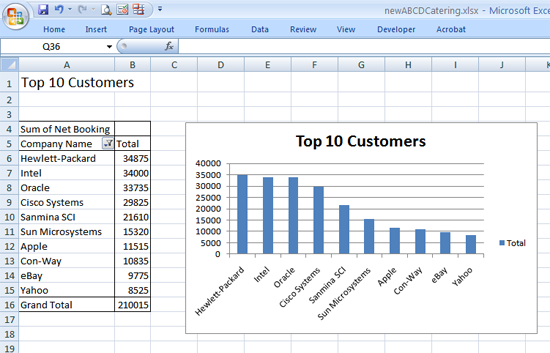
Note that some of the company names are 15 characters or longer in length and occupy much of the chart space. It would be nice to have a shorter "nickname" for each company that could be used in the charts. One solution is to cut and paste the pivot table data, then modify the Company Name information by hand. Unfortunately, this would be very tedious. Another approach is to automate the process in the script and create a new column derived from a comprehensive reference table of company names and nicknames. The downside is that maintaining the list could be an issue as the business grows and the list of customers grows longer. A third method is to create an algorithm that uses the first word in the company name wherever possible, and uses a defined nickname for other special cases. "Sun Microsystems" becomes "Sun" and "Cisco Systems" becomes "Cisco", while other company names such as "Hewlett-Packard" could be listed in a lookup with a nickname such as "HP". The snippet below shows how this is done.
logolookup = {'Applied Materials':'AMAT', 'Electronic Arts':'EA',
              'Hewlett-Packard':'HP', 'KLA-Tencor':'KLA'}
if ("Company Name" in newdata[0]):
    cindx = newdata[0].index("Company Name")
    newdata[0][cindx+1:cindx+1] = ["Logo Name"]
    for rcnt in range(1,len(newdata)):
        if newdata[rcnt][cindx] in logolookup:
            newdata[rcnt][cindx+1:cindx+1] = [logolookup[newdata[rcnt][cindx]]]
        else:
            newname = newdata[rcnt][cindx].split()[0]
            newdata[rcnt][cindx+1:cindx+1] = [newname]
            logolookup[newdata[rcnt][cindx]] = newname
This code begins with a simple lookup for company names and can be easily extended as special case company names are added. Next, the column location of the "Company Name" field is identified and the new header "Logo Name" is inserted after "Company Name" in the list using the :file:list[index:index] construct. The :file:for loop iterates over each row in the table, checking whether the company name for that row exists in the :file:logolookup dictionary, then inserting the abbreviated name. If not found, then the original company name is :file:split() into words and the first word used as the new abbreviated name. Finally, the :file:logolookup dictionary is updated with the new abbreviated name.
After running the program, the new column "Logo Name" has been inserted after "Company Name" and contains the shortened company names.
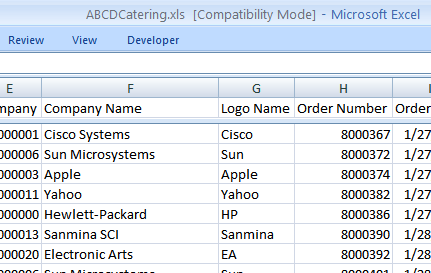
The new "Logo Name" column can be used in the previous pivot table and chart, replacing the "Company Name" field and producing a cleaner chart with less area used for displaying company name information.
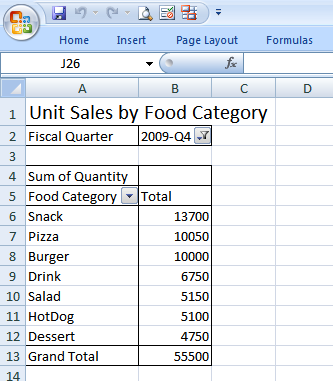
Another use of this technique is to add a label for "Food Category" based on the type of food purchased. For example, the food items sold by ABCD Catering are: Caesar Salad, Cheese Pizza, Cheeseburger, Chocolate Sundae, Churro, Hamburger, Hot Dog, Pepperoni Pizza, Potato Chips and Soda. Let's say that your manager wants to track the sales of different food categories, such as Burger, Dessert, HotDog, Drink, Pizza, Salad and Snack. Using the same technique outlined above, this code will add a column for Food Category with the appropriate entry for each food item:
foodlookup = {'Caesar Salad':'Salad', 'Cheese Pizza':'Pizza',
              'Cheeseburger':'Burger', 'Chocolate Sundae':'Dessert',
              'Churro':'Snack', 'Hamburger':'Burger', 'Hot Dog':'HotDog',
              'Pepperoni Pizza':'Pizza', 'Potato Chips':'Snack',
              'Soda':'Drink'}
if ("Food Name" in newdata[0]):
    cindx = newdata[0].index("Food Name")
    newdata[0][cindx+1:cindx+1] = ["Food Category"]
    for rcnt in range(1,len(newdata)):
        if newdata[rcnt][cindx] in foodlookup:
            newdata[rcnt][cindx+1:cindx+1] = [foodlookup[newdata[rcnt][cindx]]]
        else:
            newdata[rcnt][cindx+1:cindx+1] = ['UNDEFINED']
If a food item is not found in the lookup, the category is labeled UNDEFINED. This is an indication that there is a problem with the script and the lookup for food categories needs to be extended.
The section of the script which creates the pivot tables can be easily extended to build a new table based on the newly created label "Food Category":
# What food category had the highest unit sales in Q4?
ptname = addpivot(wb,src,
         title="Unit Sales by Food Category",
         filters=("Fiscal Quarter",),
         columns=(),
         rows=("Food Category",),
         sumvalue="Sum of Quantity",
         sortfield=("Food Category",win32c.xlDescending))
wb.Sheets("Unit Sales by Food Category").PivotTables(ptname).PivotFields("Fiscal Quarter").CurrentPage = "2009-Q4"
Based on the output spreadsheet, the best selling food category in Q4 based on quantity is "Snack", with sales of 13700 units.
Here is the completed erppivotextended.py script, also available on GitHub
#
# erppivotextended.py:
# Load raw EPR data, clean up header info,
# insert additional data fields and build 5 pivot tables
#
import win32com.client as win32
win32c = win32.constants
import sys
import itertools
tablecount = itertools.count(1)

def addpivot(wb,sourcedata,title,filters=(),columns=(),
             rows=(),sumvalue=(),sortfield=""):
    """Build a pivot table using the provided source location data
    and specified fields
    """
    newsheet = wb.Sheets.Add()
    newsheet.Cells(1,1).Value = title
    newsheet.Cells(1,1).Font.Size = 16

    # Build the Pivot Table
    tname = "PivotTable%d"%tablecount.next()

    pc = wb.PivotCaches().Add(SourceType=win32c.xlDatabase,
                                 SourceData=sourcedata)
    pt = pc.CreatePivotTable(TableDestination="%s!R4C1"%newsheet.Name,
                             TableName=tname,
                             DefaultVersion=win32c.xlPivotTableVersion10)
    wb.Sheets(newsheet.Name).Select()
    wb.Sheets(newsheet.Name).Cells(3,1).Select()
    for fieldlist,fieldc in ((filters,win32c.xlPageField),
                            (columns,win32c.xlColumnField),
                            (rows,win32c.xlRowField)):
        for i,val in enumerate(fieldlist):
            wb.ActiveSheet.PivotTables(tname).PivotFields(val).Orientation = fieldc
            wb.ActiveSheet.PivotTables(tname).PivotFields(val).Position = i+1

    wb.ActiveSheet.PivotTables(tname).AddDataField(
        wb.ActiveSheet.PivotTables(tname).PivotFields(sumvalue[7:]),
        sumvalue,
        win32c.xlSum)
    if len(sortfield) != 0:
        wb.ActiveSheet.PivotTables(tname).PivotFields(sortfield[0]).AutoSort(sortfield[1], sumvalue)
    newsheet.Name = title

    # Uncomment the next command to limit output file size, but make sure
    # to click Refresh Data on the PivotTable toolbar to update the table
    # newsheet.PivotTables(tname).SaveData = False

    return tname

def runexcel():
    """Open the spreadsheet ABCDCatering.xls, clean it up,
    and add pivot tables
    """
    excel = win32.gencache.EnsureDispatch('Excel.Application')
    excel.Visible = True
    try:
        wb = excel.Workbooks.Open('ABCDCatering.xls')
    except:
        print "Failed to open spreadsheet ABCDCatering.xls"
        sys.exit(1)
    ws = wb.Sheets('Sheet1')
    xldata = ws.UsedRange.Value
    newdata = []
    for row in xldata:
        if len(row) == 13 and row[-1] is not None:
            newdata.append(list(row))
    lasthdr = "Col A"
    for i,field in enumerate(newdata[0]):
        if field is None:
            newdata[0][i] = lasthdr + " Name"
        else:
            lasthdr = newdata[0][i]

    logolookup = {'Applied Materials':'AMAT', 'Electronic Arts':'EA',
                  'Hewlett-Packard':'HP', 'KLA-Tencor':'KLA'}
    if ("Company Name" in newdata[0]):
        cindx = newdata[0].index("Company Name")
        newdata[0][cindx+1:cindx+1] = ["Logo Name"]
        for rcnt in range(1,len(newdata)):
            if newdata[rcnt][cindx] in logolookup:
                newdata[rcnt][cindx+1:cindx+1] = [logolookup[newdata[rcnt][cindx]]]
            else:
                newname = newdata[rcnt][cindx].split()[0]
                newdata[rcnt][cindx+1:cindx+1] = [newname]
                logolookup[newdata[rcnt][cindx]] = newname

    foodlookup = {'Caesar Salad':'Salad', 'Cheese Pizza':'Pizza',
                  'Cheeseburger':'Burger', 'Chocolate Sundae':'Dessert',
                  'Churro':'Snack', 'Hamburger':'Burger', 'Hot Dog':'HotDog',
                  'Pepperoni Pizza':'Pizza', 'Potato Chips':'Snack',
                  'Soda':'Drink'}
    if ("Food Name" in newdata[0]):
        cindx = newdata[0].index("Food Name")
        newdata[0][cindx+1:cindx+1] = ["Food Category"]
        for rcnt in range(1,len(newdata)):
            if newdata[rcnt][cindx] in foodlookup:
                newdata[rcnt][cindx+1:cindx+1] = [foodlookup[newdata[rcnt][cindx]]]
            else:
                newdata[rcnt][cindx+1:cindx+1] = ['UNDEFINED']

    rowcnt = len(newdata)
    colcnt = len(newdata[0])
    wsnew = wb.Sheets.Add()
    wsnew.Range(wsnew.Cells(1,1),wsnew.Cells(rowcnt,colcnt)).Value = newdata
    wsnew.Columns.AutoFit()

    src = "%s!R1C1:R%dC%d"%(wsnew.Name,rowcnt,colcnt)

    # What were the total sales in each of the last four quarters?
    addpivot(wb,src,
             title="Sales by Quarter",
             filters=(),
             columns=(),
             rows=("Fiscal Quarter",),
             sumvalue="Sum of Net Booking",
             sortfield=())

    # What are the sales for each food item in each quarter?
    addpivot(wb,src,
             title="Sales by Food Item",
             filters=(),
             columns=("Food Name",),
             rows=("Fiscal Quarter",),
             sumvalue="Sum of Net Booking",
             sortfield=())

    # Who were the top 10 customers for ABCD Catering in 2009?
    addpivot(wb,src,
             title="Top 10 Customers",
             filters=(),
             columns=(),
             rows=("Company Name",),
             sumvalue="Sum of Net Booking",
             sortfield=("Company Name",win32c.xlDescending))

    # Who was the highest producing sales rep for the year?
    addpivot(wb,src,
             title="Top Sales Reps",
             filters=(),
             columns=(),
             rows=("Sales Rep Name","Company Name"),
             sumvalue="Sum of Net Booking",
             sortfield=("Sales Rep Name",win32c.xlDescending))

    # What food item had the highest unit sales in Q4?
    ptname = addpivot(wb,src,
             title="Unit Sales by Food",
             filters=("Fiscal Quarter",),
             columns=(),
             rows=("Food Name",),
             sumvalue="Sum of Quantity",
             sortfield=("Food Name",win32c.xlDescending))
    wb.Sheets("Unit Sales by Food").PivotTables(ptname).PivotFields("Fiscal Quarter").CurrentPage = "2009-Q4"

    # What food category had the highest unit sales in Q4?
    ptname = addpivot(wb,src,
             title="Unit Sales by Food Category",
             filters=("Fiscal Quarter",),
             columns=(),
             rows=("Food Category",),
             sumvalue="Sum of Quantity",
             sortfield=("Food Category",win32c.xlDescending))
    wb.Sheets("Unit Sales by Food Category").PivotTables(ptname).PivotFields("Fiscal Quarter").CurrentPage = "2009-Q4"

    if int(float(excel.Version)) >= 12:
        wb.SaveAs('newABCDCatering.xlsx',win32c.xlOpenXMLWorkbook)
    else:
        wb.SaveAs('newABCDCatering.xls')
    excel.Application.Quit()

if __name__ == "__main__":
    runexcel()
Prerequisites
Python (refer to http://www.python.org)
Win32 Python module (refer to http://sourceforge.net/projects/pywin32)
Microsoft Excel (refer to http://office.microsoft.com/excel)
Source Files and Scripts
Source for the program erppivotextended.py and spreadsheet file ABCDCatering.xls are available at http://github.com/pythonexcels/examples
Thanks — Dan